Solana price analysis shows that the token is trading in bears today. After hitting an all-time high earlier today, the crypto fell spectacularly to reach a low of $13.98, a major bearish sign, losing all the gains market during the rally. The support at $13.94 also fell, further fueling the bearish sentiment in Solana price, and if it brokes further, the token could continue to fall even lower, while the resistance for SOL/USD is at $14.31. which may provide some short-term relief. If you are trading SOL, be aware of these price movements and use caution in your trades.
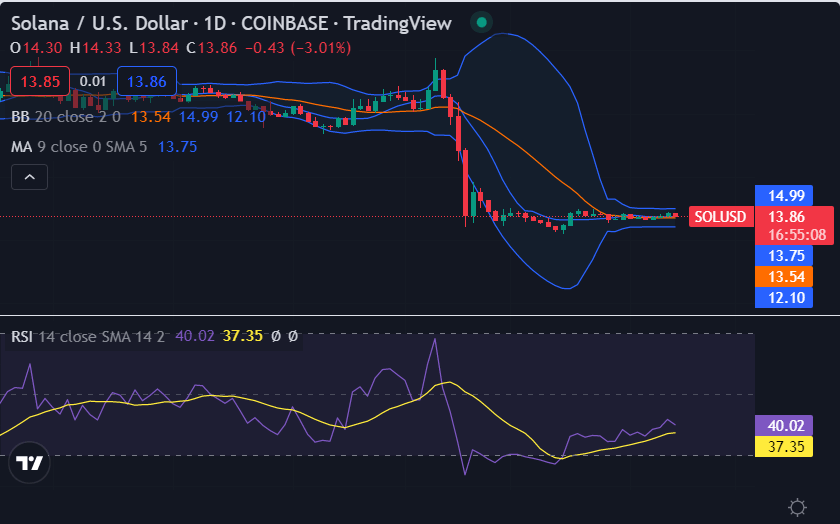
SOL/USD 1-day price chart: Solana continues looking for its supports
The 1-day price chart for Solan price analysis shows the token is on a downtrend for a second day, though the bulls were seen attempting to push the price higher toward the $14.31 support level, it was not able to hold this point and continue trading lower. The price further covered a range downwards, and SOL is trading at $13.98 at the time of writing, reporting a one percent loss over the last 24 hours, but still reports an increase of more than 2.17 percent in price value over the past week.

The volatility is still high for the token as the Bollinger bands show expansion, with the upper band at $14.67 and the lower band at $13.71, which could provide some additional pressure on both sides as the price moves within these bands. The moving average (MA) has just surpassed the price level as the price continues its downfall, which is a further indication of strengthing of the bearish trend. The relative strength index (RSI) is also on a downward curve in the upper half of the neutral zone, trading at index 37.35, showing more selling activity in the market for SOL/USD pair.
Solana price analysis: Recent developments and further technical indications
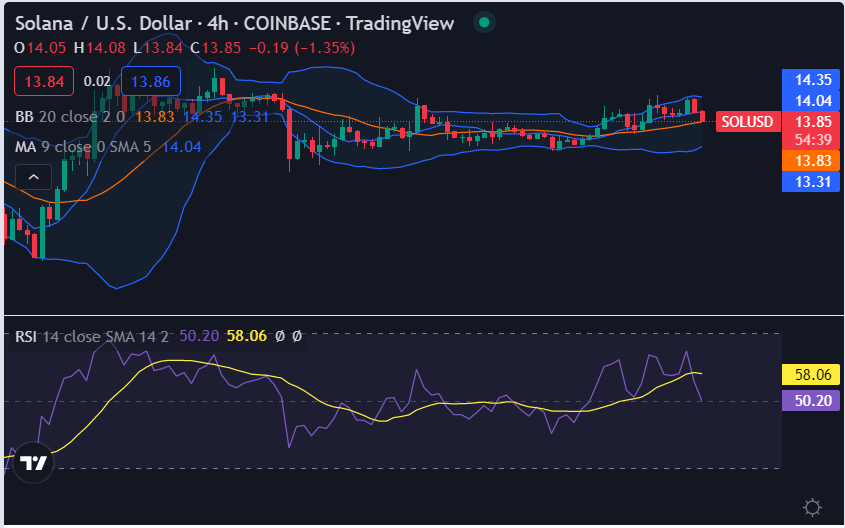
The 4-hour Solana price analysis shows the price breakout was downwards at the start of today’s trading session following a little upwards movement of the price at the start of today’s trading session, but bears took over again and started the day in their own favor, the downfall still continues at the time of writing. The moving average on the 4-hour chart is currently at the $13.59 mark. The RSI on the 4-hour chart is currently at index 32 showing that there are still more sellers in the market than buyers, suggesting further losses unless we see a reversal of the trend soon.

As the price oscillation has slowed down for today, so the volatility also started decreasing for the token, and the Bollinger bands started converging steeply now, with the upper band present at $14.35, and the lower band at $13.31, the average is at $13.96. As the price on the 4-hour chart is trading between the lower band and the mean average of the indicator, they represent the support and resistance levels for the SOL/USD pair.
Solana price analysis conclusion
To conclude, it seems that Solana’s price analysis remains bearish for now, with the token trading in a downward trend and struggling to find support. But the bullish may return in the short term, and we may see a price breakout.
Disclaimer. The information provided is not trading advice. Cryptopolitan.com holds no liability for any investments made based on the information provided on this page. We strongly recommend independent research and/or consultation with a qualified professional before making any investment decisions.
