In the past few weeks, a Shiba inu-themed token took center stage in the Solana ecosystem as sentiment around the blockchain network took a hit in the aftermath of the Sam Bankman-Fried and FTX debacle. CoinDesk’s Shaurya Malwa took a closer look at Bonk Inu:
This article originally appeared in Crypto Markets Today, CoinDesk’s daily newsletter diving into what happened in today’s crypto markets. Subscribe to get it in your inbox every day.
-
Called Bonk Inu, the project with a cute dog holding a bat as a mascot, launched with just a homepage and a “bonk paper” in the final weeks of 2022.
-
But the lack of clear team information or even a dedicated community channel didn’t deter entrants from punting their hopes: The project’s token, BONK, ran up as much as 3,200% in just three weeks, almost single-handedly inciting activity in the Solana ecosystem, as previously reported.
-
Bonk Inu is a team of 22 individuals with no singular leader, all of whom were involved in the inception of the project, CoinDesk learned from one of the several developers. All of them have previously built decentralized applications (DeFi), non-fungible tokens (NFT) and other related products on Solana.
-
The bonk airdrop – amounting to 50% of its token supply – likely drove massive community interest and instant hype. Some 20% of the total airdrop supply is going to Solana non-fungible token collections – comprising 297,000 individual NFTs – and 10% to Solana-focused artists and collectors. Airdrops refer to an unsolicited distribution of a cryptocurrency token or coin, usually for free, to numerous wallet addresses and are generally used as a tactic to gain users.
-
Following Solana taking a hit after the FTX’s collapse, the 22 Solana developers wasted no time in distancing themselves from Sam Bankman-Fried’s dirt. They banded together to build a “community coin” – and decided that a dog-themed protocol was the way to go.
-
The team does not see itself as a dogecoin or shiba inu rival and points out BONK is already different from the gazillions of dog-themed meme coins already on the market.

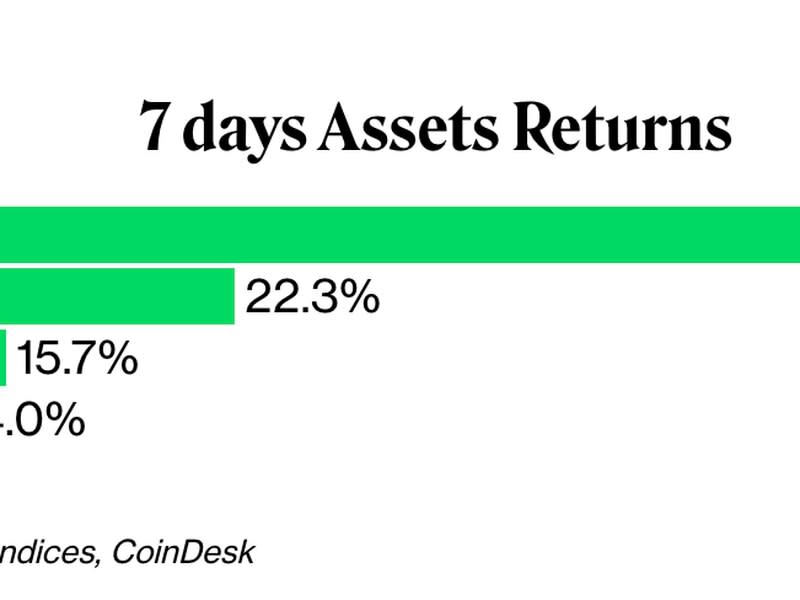
Bitcoin (BTC): The largest cryptocurrency by market value held strong at $19,800 Friday, rising 5% for the day and 15.7% for the week – the best weekly performance since March. Consistent with the rally, bitcoin options’ “volatility smile” shows the demand for out-of-the-money call options – bullish bets at strikes higher than the cryptocurrency’s going market price – has increased relative to puts or bearish bets.
Equities closed higher Friday as traders processed big banks’ fourth-quarter earnings reports including from JPMorgan. The tech-heavy Nasdaq Composite was up 0.7%, while the S&P 500 and Dow Jones Industrial Average (DJIA) were up 0.4% and 0.3%, respectively.
Bitcoin cash (BCH): The BCH price surged nearly 10% at one point Friday as traders assessed the market impact of potential network changes ahead of the Bitcoin Cash protocol’s May hard fork. BCH broke above resistance levels of $108 to as much as $125 in the past 24 hours. It had settled back to $122 as of publication time.
Ether (ETH): The second-largest cryptocurrency was recently trading flat at $1,427. The ether price rose 12.9% over the past week. The Ethereum blockchain’s Merge last year turned into a focus of frenzied speculation in crypto markets. Now, digital-asset traders are starting to handicap various market scenarios ahead of Ethereum’s next big milestone, known as the “Shanghai hard fork.”
Decentraland (MANA): The native token of metaverse project Decentraland surged Friday as metaverse tokens became the best-performing digital assets since the start of this year. MANA’s price rose 23% to 50 cents at the time of publication. The recent price jump came as Decentraland introduced new features for users.
939.55
+26.5 ▲ 2.9%
$19,808
+945.4 ▲ 5.0%
$1,454
+26.2 ▲ 1.8%
S&P 500 daily close
3,999.09
+15.9 ▲ 0.4%
Gold
$1,923
+27.8 ▲ 1.5%
Treasury Yield 10 Years
3.51%
▲ 0.1
BTC/ETH prices per CoinDesk Indices; gold is COMEX spot price. Prices as of about 4 p.m. ET
Crypto Market Analysis: A Fresh Look at Bitcoin Price Charts After Biggest Rally in 9 Months
By Glenn Williams Jr.
From a chart watchers’ perspective, there are two opposing points:
-
Bitcoin’s rise to $19,000 moves it to a key area of potential new support.
-
Bitcoin’s rise to $19,000 also moves it to historically overbought levels.
Point one can be seen using the Visible Range Volume Profile tool, which shows BTC moving from one high-volume node area near $16,700 to another high-volume node area near $19,200.
The significance is that areas of high volume imply areas of high price agreement. These areas often serve as levels of support and/or resistance, and help explain why BTC prices were mired between $16,000 and $17,000 for so long.
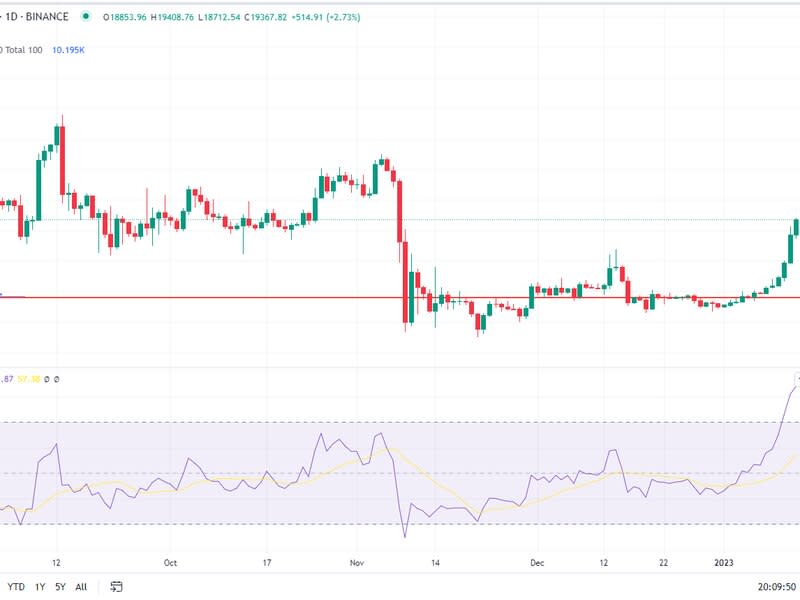
Point two is illustrated via the BTC’s current Relative Strength Index (RSI) reading of 84. The RSI is a momentum indicator ranging from 0 to 100. Readings of 30 and below imply that an asset is overpriced. By contrast, readings of 70 and above imply that an asset may be overpriced.
BTC’s current reading is its highest reading since January 2021. Since 2018, BTC’s RSI has been higher than 84 just 25 times. This isn’t to say that an asset can’t stay overbought for extended periods. The 91 RSI level reached on Jan 8, 2021, was followed by a 15% increase in price 30 days later. It should be monitored.

